Plexus
Plexus - Interactive Emotion Visualization based on Social Media
Modules
Plexus is essentially written with three main modules to produce a complete visualization.
1. Data Processing
Twitter4J, an unofficial Java library for the Twitter API, processes all the search queries from Twitter.
2. Emotion Analysis
Johnson-laird and Oatley [1] produced a theory that there are five basic emotion modes: happiness, sadness, fear, anger, and disgust, and other emotional states are only subsets of these five emotions. Because all emotions are based on the five basic families of emotion modes, this theory states that a word can attribute to more than one emotion modes. Therefore, categorizing a word or text to a single emotion is oftentimes inappropriate. For texts with complex emotions, a quantitative analysis for all five emotion modes is significant for the accuracy of the investigation.
The emotion analysis module in this software is based on the AlchemyLanguage service from IBM, which offers a collection of functions and APIs for natural language processing and analysis. The Emotion Analysis function can analyze any textual information in English and return the detected emotions and their relevance values. It can not only analyze the overall emotions of an entire text, but also find out the emotions associated with individual entities or keywords which are also identified by AlchemyLanguage. The relevance values returned along with five emotions indicate the confidence levels for each of them, making it convenient for developers to quantify the emotions.
The emotion analysis results returned from AlchemyLanguage are in a JSON format, but they are not native JSON objects. JSON-java, a popular JSON package in Java, was used to convert the emotion results to a JSON object. This object is parsed to read the values of each emotion and assign them to five double variables (joyValue, angerValue, fearValue, disgustValue, sadnessValue). A method called getFinalEmootion was created in the GetEmotion class to return the most relevant emotion of a text based on those five created variables. In this function, a HashMap was created to store the names and values of emotions. I found HashMap is probably the easiest way to find the one with the maximum value out of five variables. It can be used to find either the maximum value or the key with the maximum, or both. If I only need to fine the maximum of five values, I can do a multiple comparison using Math.Max:
double maxVar = Math.max(firstVar, Math.max(secondVar, Math.max(thirdVar, Math.max( fourthVar, fifthVar)));
3. Visualization
There are many software toolkits and libraries available for visualization in Java, including Prefuse, Piccolo2D, JUNG, Graphviz, and Gephi. Eventually GraphStream was chosen and used to create interactive visualizations for this project. GraphStream is an open-source Java library for modeling and visualizing data in the form of dynamic graphs. It shows dynamic interaction networks for various types of data and handles the graph evolution in time. The changes and transformations of the network can be observed while the program is modeling and visualizing data.
Software Design
Java, the programming language used for this visualization tool, is an objective-oriented language. The software design was expected to accomplish a high cohesion and low coupling among the fundamental modules of Plexus. Three classes were created to perform the visualization tasks, along with two other property files.
1. TwitterVis
TwitterVis is the main class in this software package. The keywords in the Twitter API search query are defined in this class. TwitterVis retrieves the data according to the given keywords and pass them to the GetEmotion class for emotion analysis.
2. GetEmotion
GetEmotion submits streamed tweets to the AlchemyAPI service and utilizes a HashMap function to find the emotion mode with the largest relevance value.
3. Greetings
Greetings provides a simple GUI for users to input two related topics that they are interested in learning through this visualization. The visualization module will initiate after users hit the “submit” button.

4. TwitterDevApiKey
TwitterDevApiKey stores all the credential information, i.e. API tokens and keys, in the program. The reason for this design is that putting all keys in the same location makes it convenient to organize and update the license information in this package.
5. Stylesheet (CSS)
The stylesheet file was created to establish a styling framework for this visualization. All elements’ properties are defined here. Separate styles for users’ actions, such like clicking a node, can also be declared here. The entire stylesheet was written in CSS so that styles of HTML elements can be directly adapted into Plexus, a Java program.
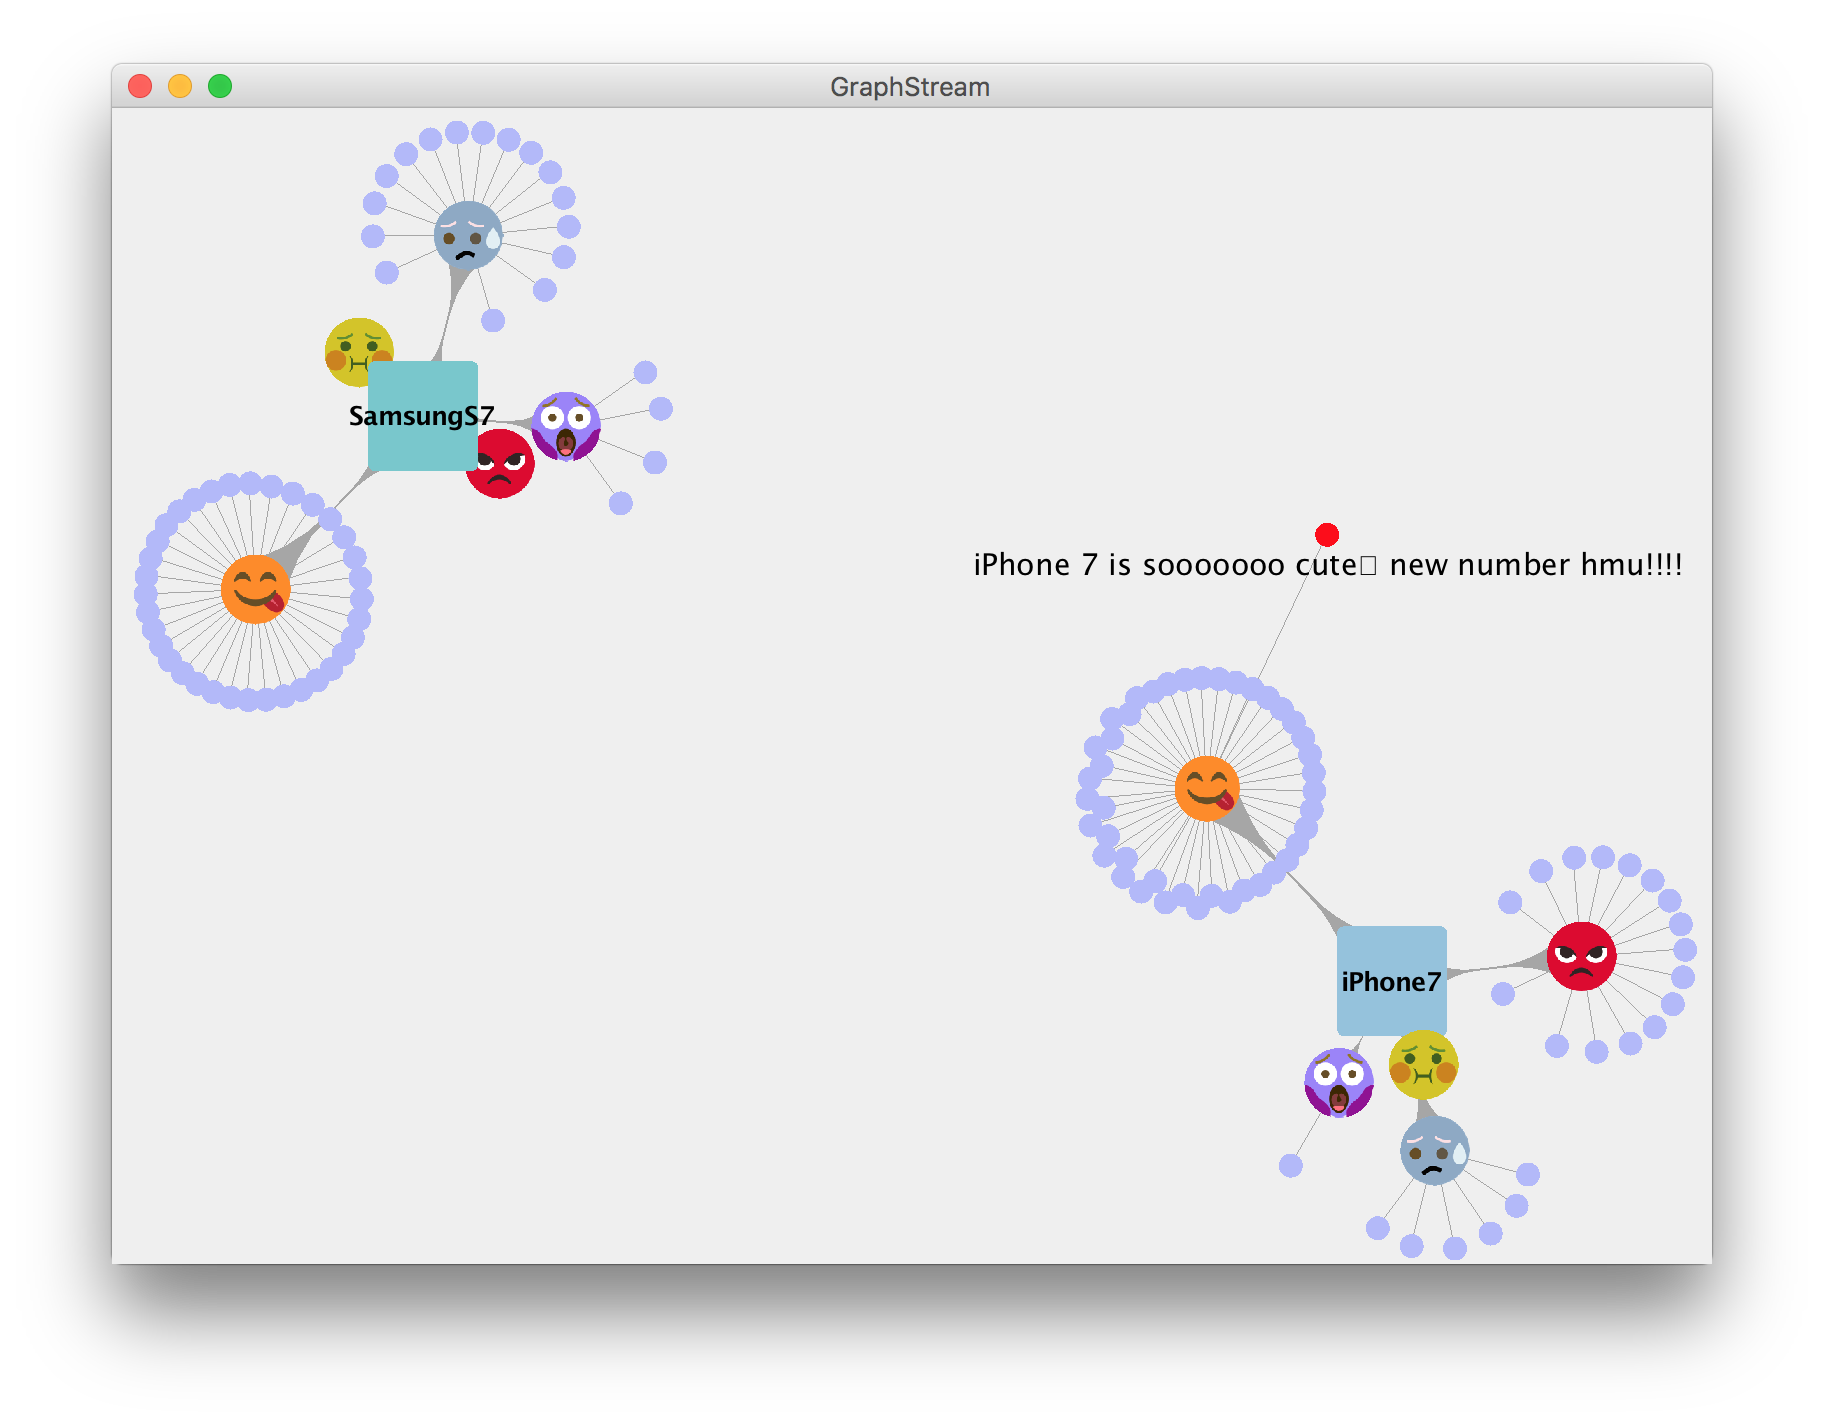
Vancouver vs. Los Angeles
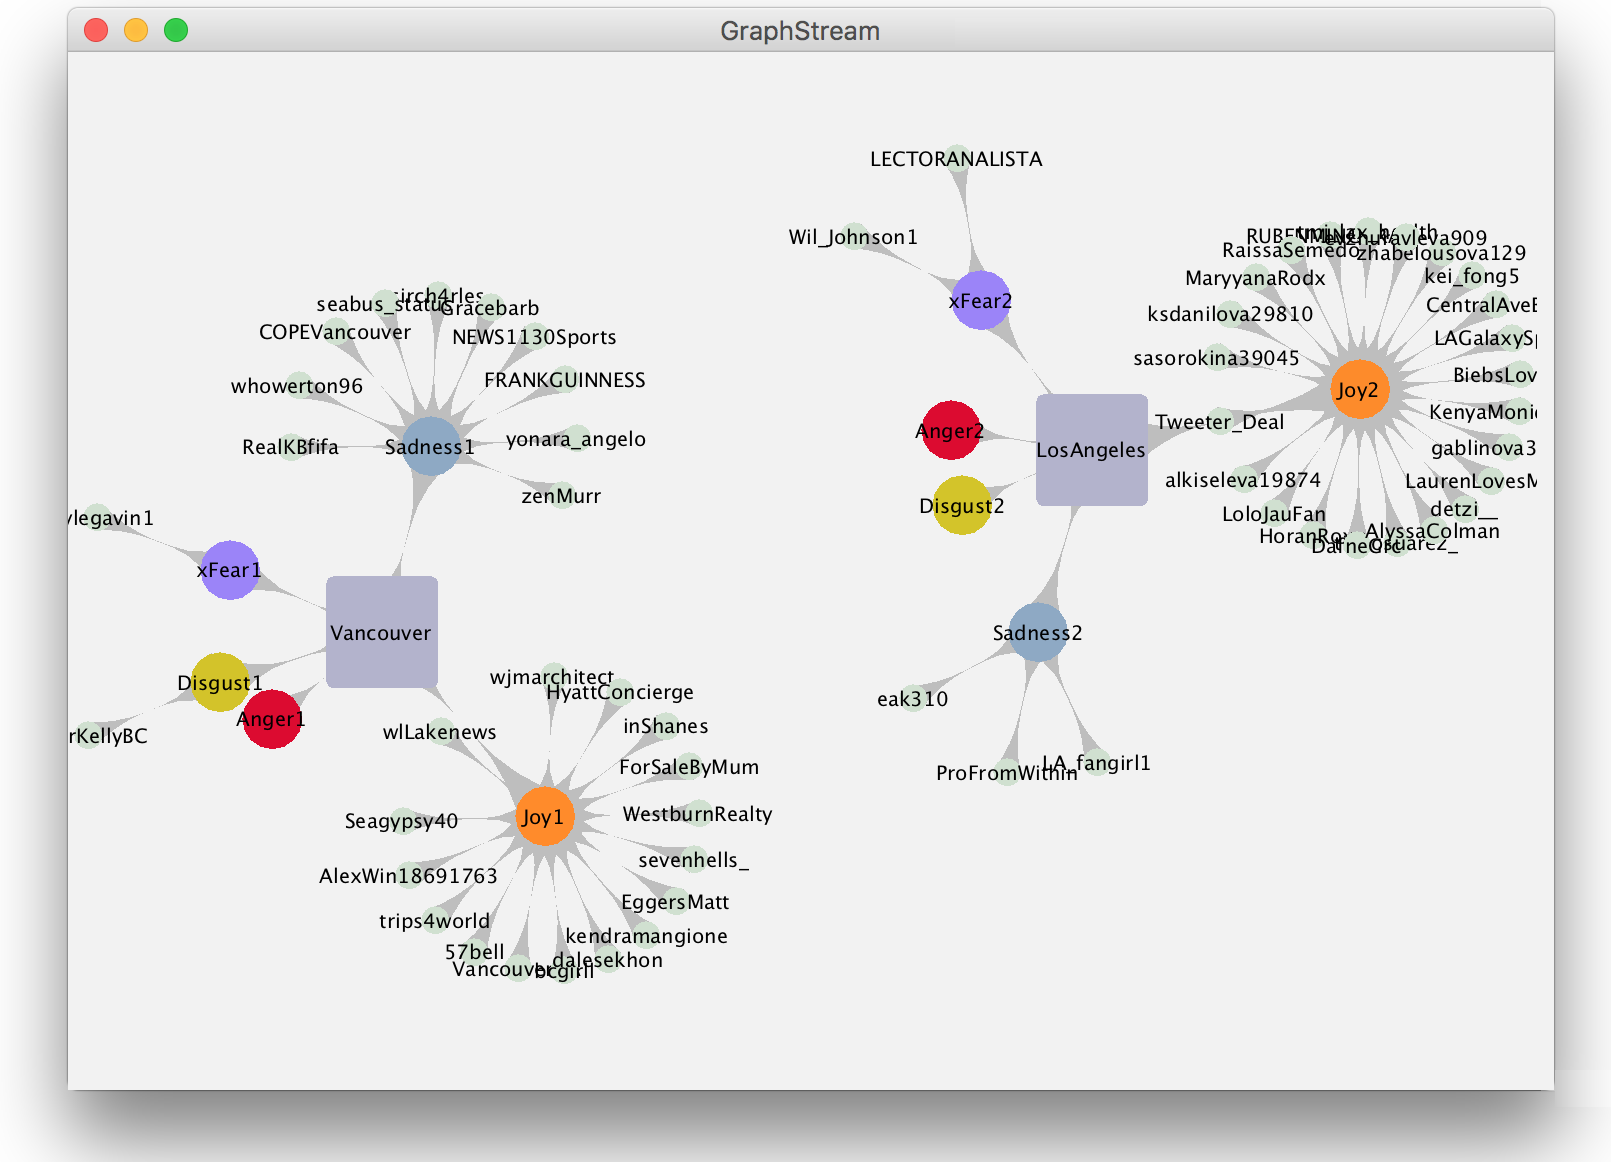
Visualization Design
A basic goal of visualizing information is to tell a story or solve a problem. To create an effective visualization, several factors such as spatial position need to be considered. Plexus provides a simple 2D model to have the visualization results presented as a force-directed network graph, in which two clusters are embedded. From the perspective of visualization, force-directed algorithms create graphs that are aesthetically engaging [2] and interactively intriguing. Since the goal of this visualization design is to create a social media data visualization for users without much prior experience or knowledge in this field,
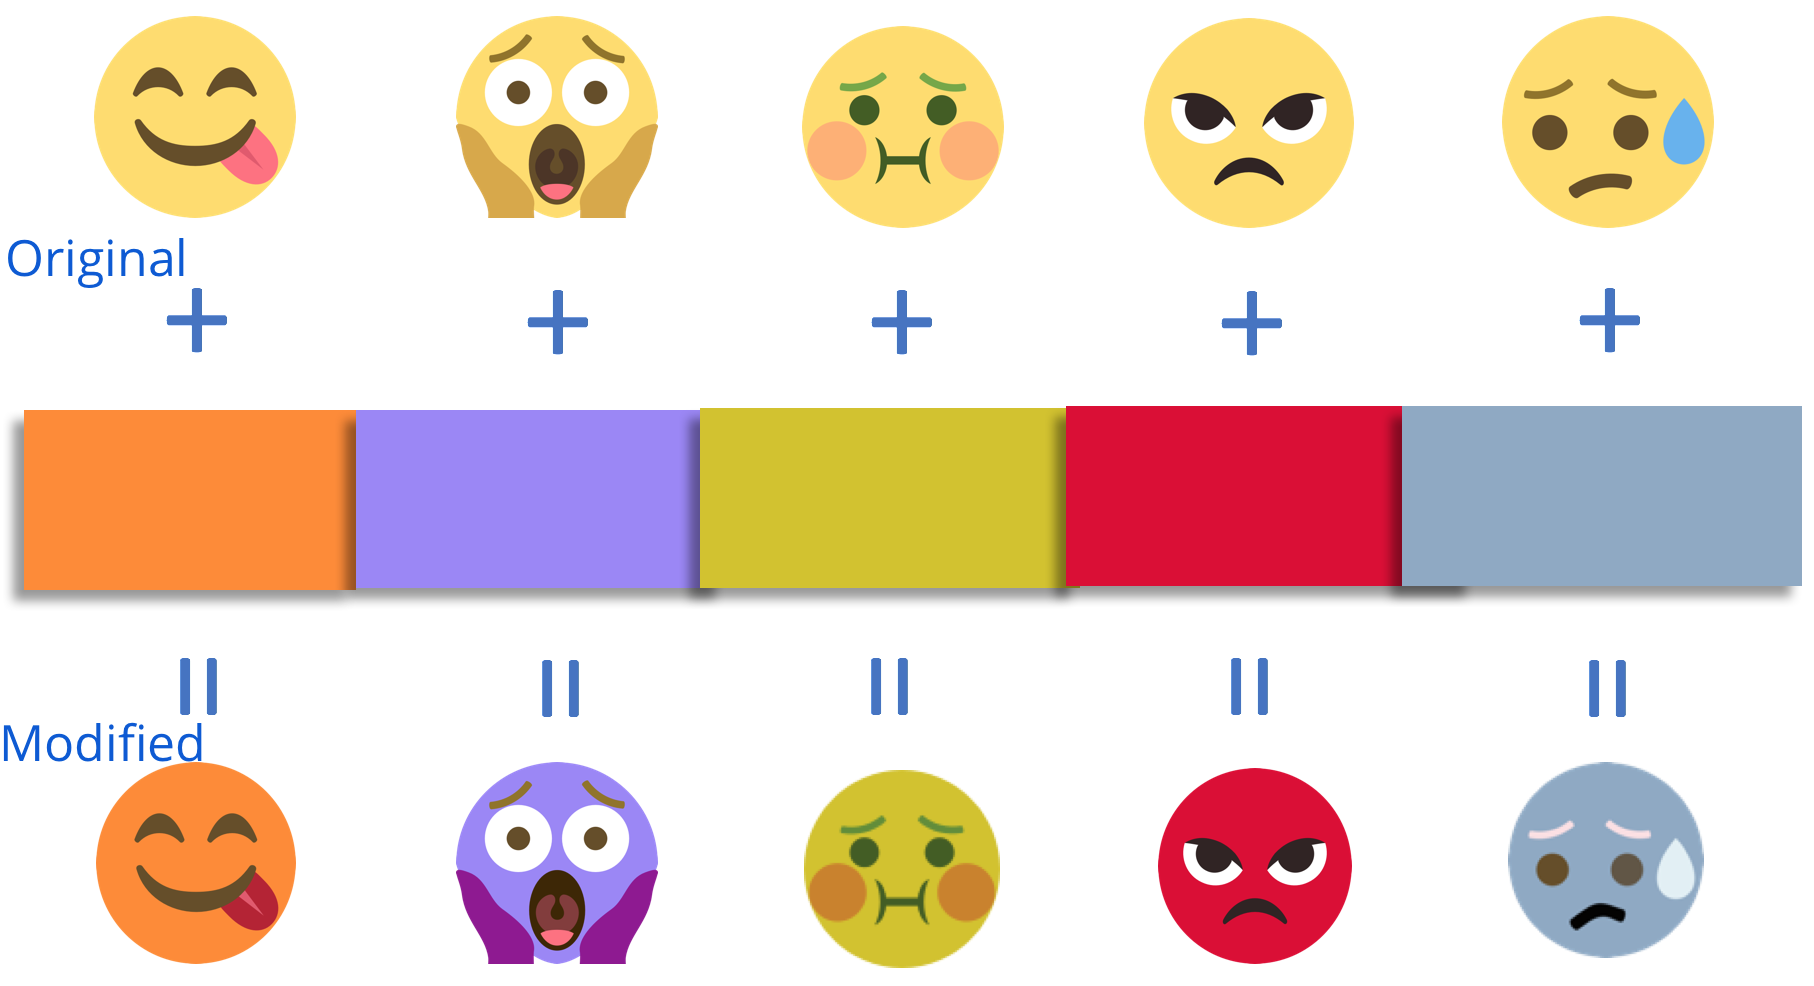
Redesigned Emoji icons:
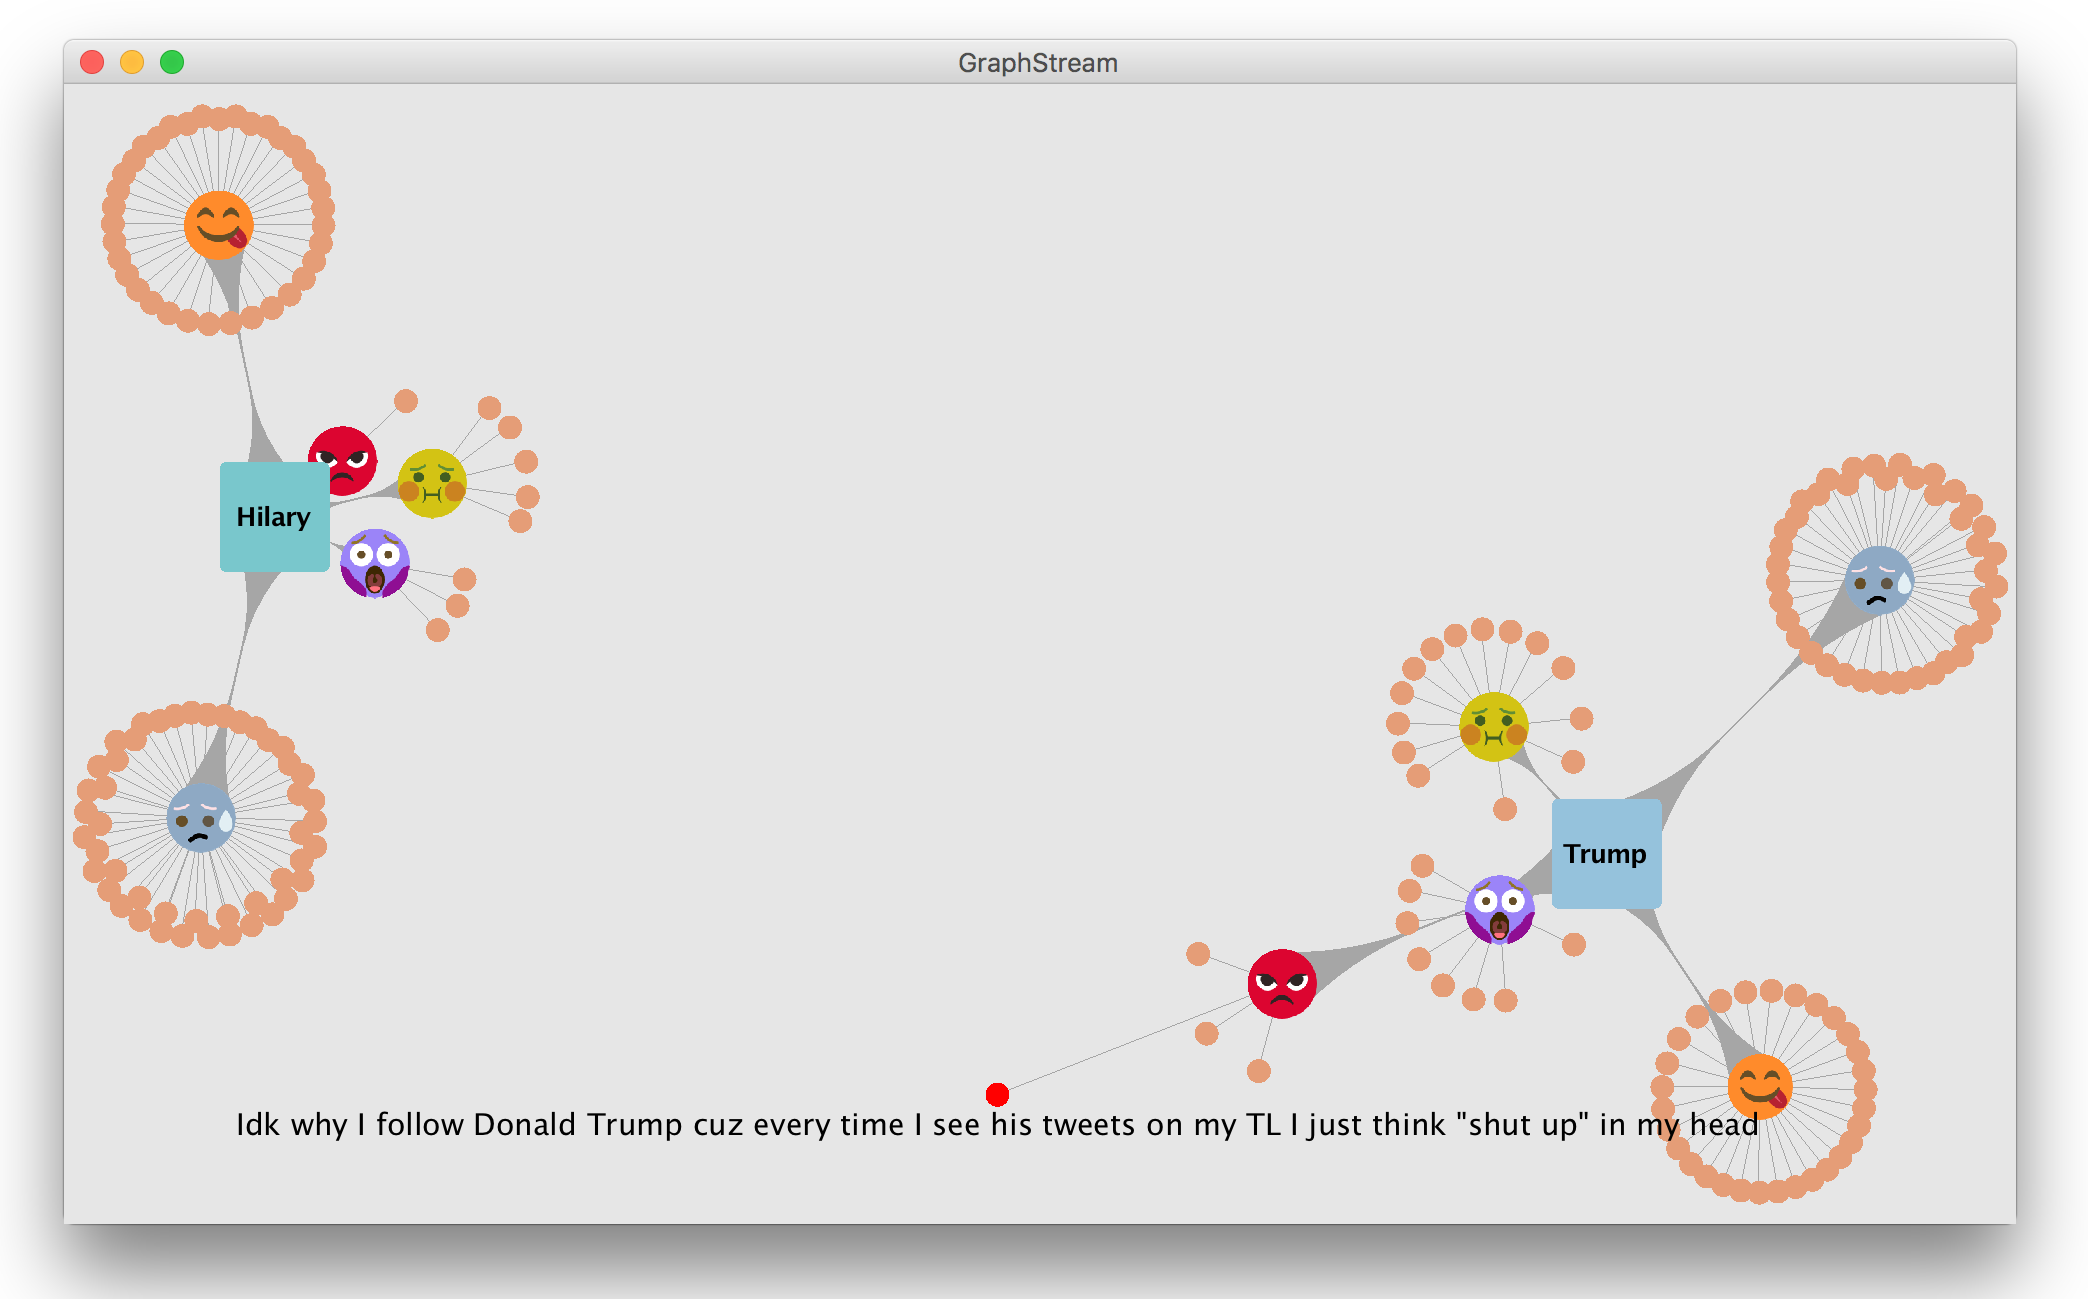
Hilary vs. Trump Visualization with the new design:
References
- P. N. Johnson-laird and Keith Oatley. 1989. The language of emotions: An analysis of a semantic field. Cognition & Emotion 3, 2: 81–123.
- Tamassia Roberto. 2013. Handbook of graph drawing and visualization (discrete mathematics and its applications). Chapman & Hall/CRC, New York.